The 1999 earthquake swarm on Gakkel Ridge
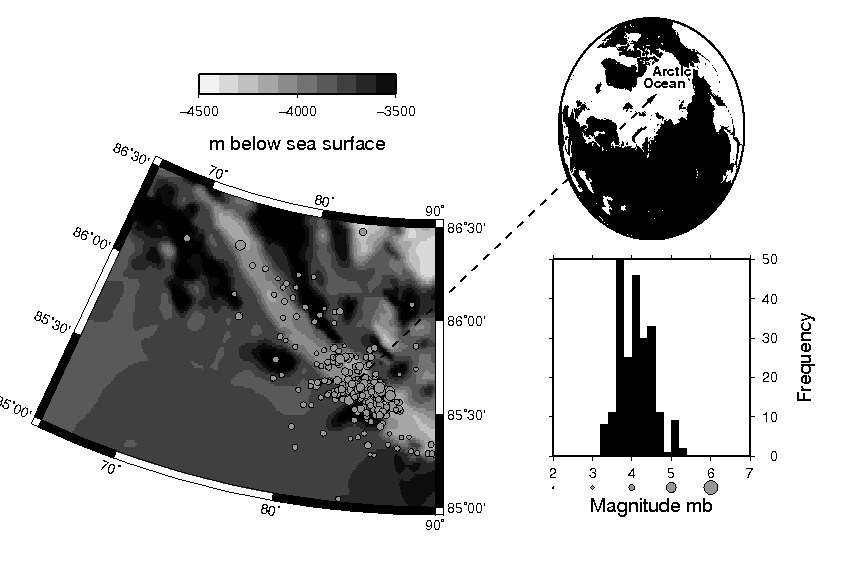
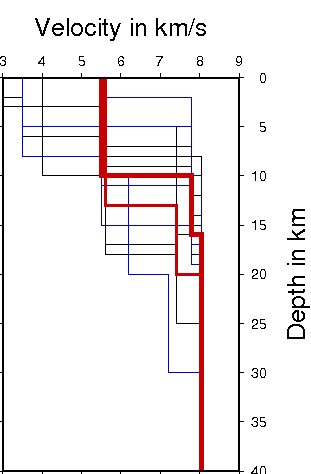
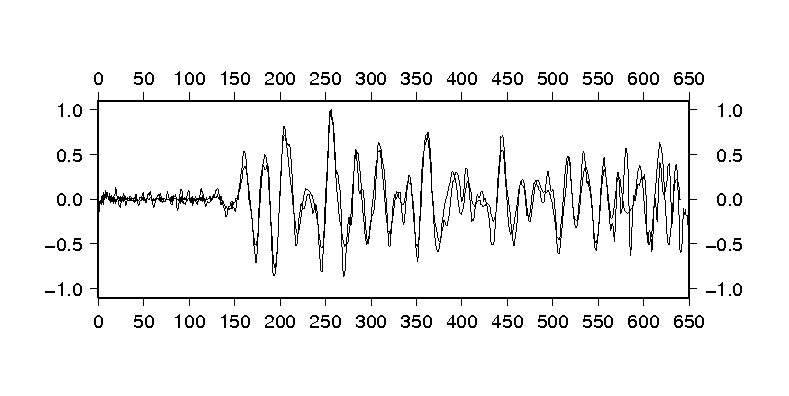
In 1999, a seismic swarm of 292 teleseismically recorded events marked a submarine eruption along the Arctic Gakkel Ridge (Fig.1), later on also analysed by sonar, bathymetric, hydrothermal and local seismic studies. We relocated the swarm with the global location algorithm HYPOSAT using various velocity models (Fig. 2) and analysed the waveforms of the stations closest to the events by cross correlation (Fig. 3). We find event locations scattered around 85°35'N and 85°E at the southern rift wall and inside the rift valley of the Gakkel ridge (Fig. 4). Waveforms and double-difference arrival times of 3 highly correlating events, which have examplarily been displayed for the canadian station of Inuvik in Fig. 3, indicate an isotropic moment tensor component and lead us to believe that the conduit is located further east at 85°35'N, 86°10'E, because the position of these 3 events which have been plotted as big stars on Fig.4 cannot be further appart than a quarter of the dominanting wavelength and should be produced by the same source process to show such a high similarity. The location result is supported by a station residual delay anomaly in the direction westernmost Alaska, because the majority of the events lyingewest of this potential conduit has to pass the potentially magma-filled area. Seismicity is focussed at the crust-mantle boundary at 16-20 km depth (Fig. 5) and can be organized in 3 phases, a pure tectonic phase (coloured in blue on Figs. 4/5), a focussed ascent phase towards the potential conduit during the beginning of April, 1999 (coloured in red on Figs. 4/5) and an adaptation phase to the new stresses (coloured in green on Figs. 4/5). The moment tensors of the high magnitude events have a high isotropic component beginning after opening of the conduit or vent in April and do not change back to pure double-couple events in the latest phase, so that we speculate that the conduit/vent might have remained open during the following years.
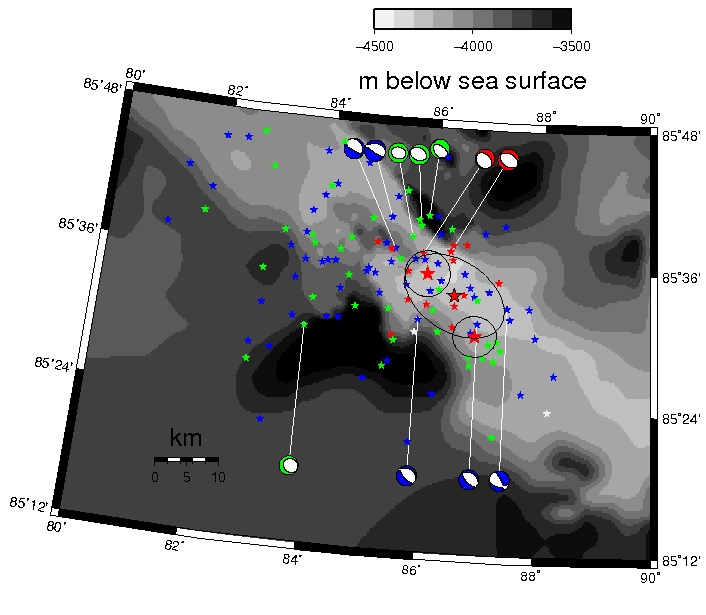
Figure 4: The improved locations and the global centroid moment tensor solutions of the swarm events. Colours of the stars indicate the phase (blue: initial, red: ascent, green: stress adaptation).
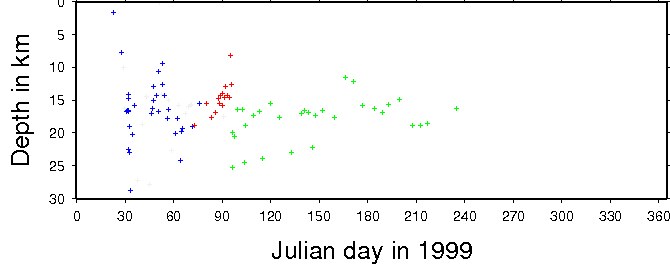
Figure 5: The depth over time figure for the entire swarm, in which 5 succeeding events have been used to calculate a median depth, which is plotted here. Colours of the crosses indicate the phase (blue: initial, red: ascent, green: stress adaptation).
Publications
Peer-reviewedC. Riedel, V. Schlindwein (2009) Did the 1999 earthquake swarm on Gakkel Ridge open a volcanic conduit ? - a detailed teleseismic data analysis, submitted to Journal of Seismology